

See Your Trading Month. Understand Each Day.
View your recorded trading results in a monthly calendar. Select a date to review its trades, examine the daily summary and keep your reflections in a note shared with Dashboard and Discipline.
- Daily results at a glance
- Trades and daily summaries
- Shared daily notes
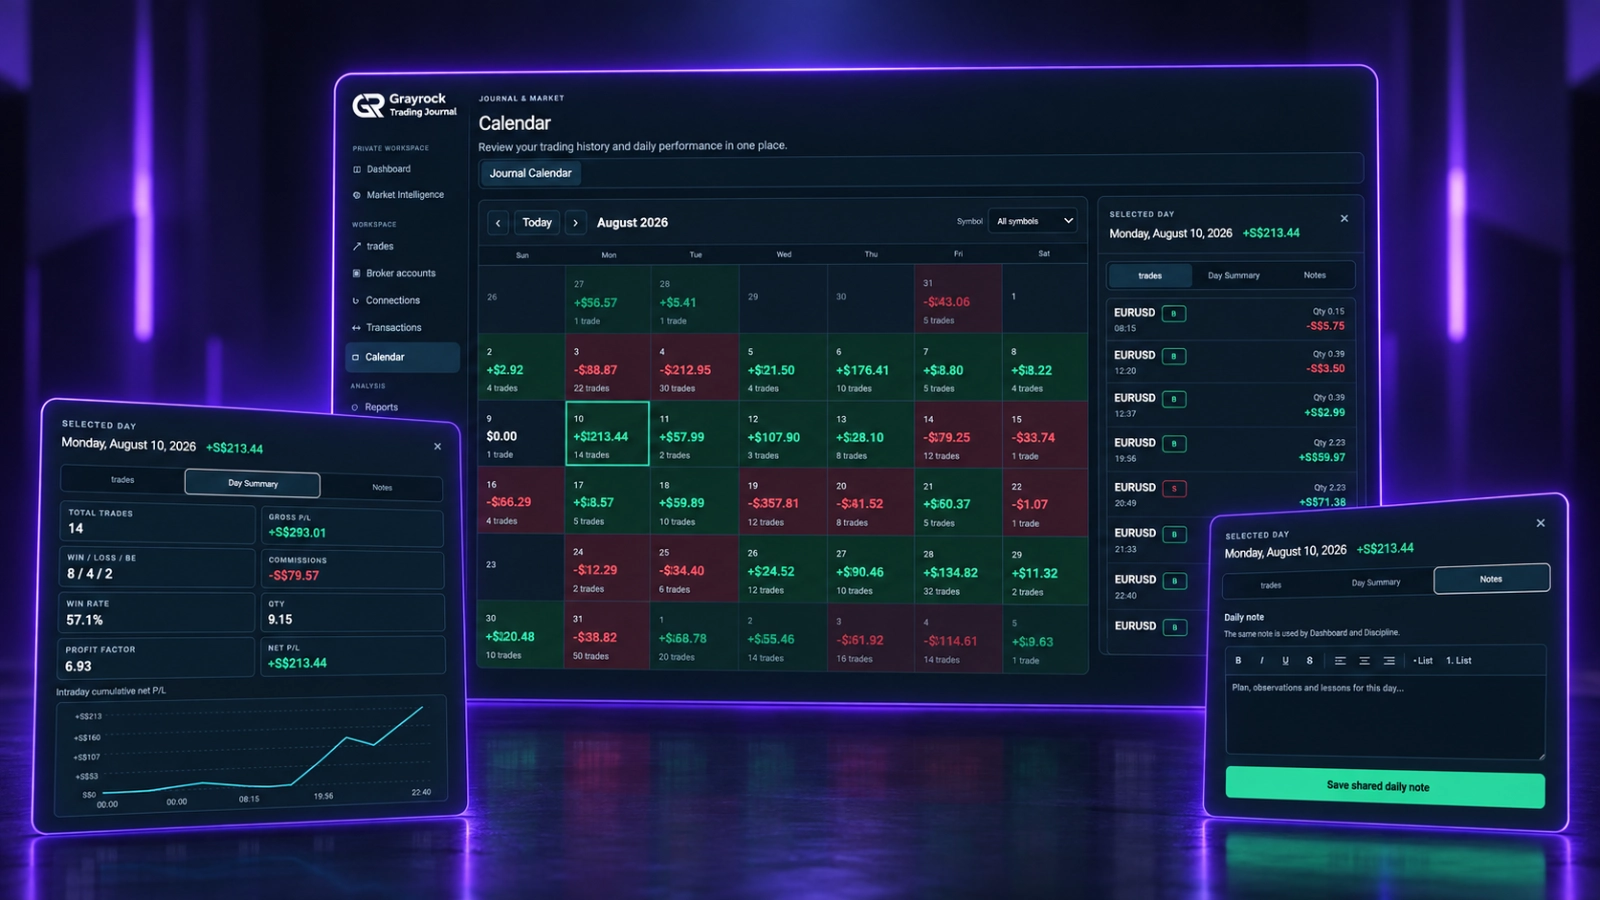
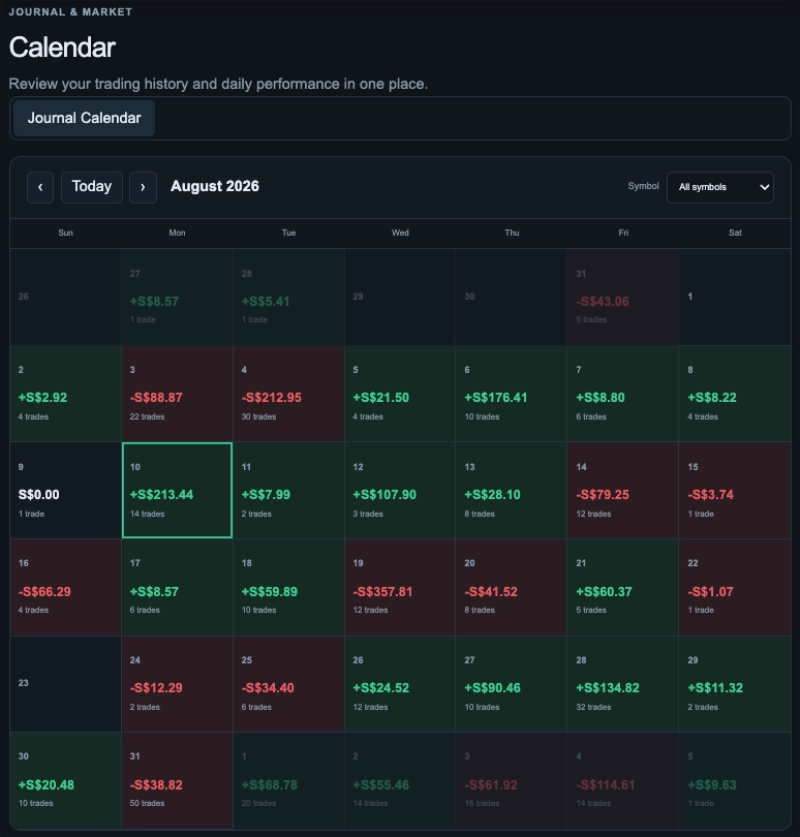
See How Your Results Are Spread Across the Month.
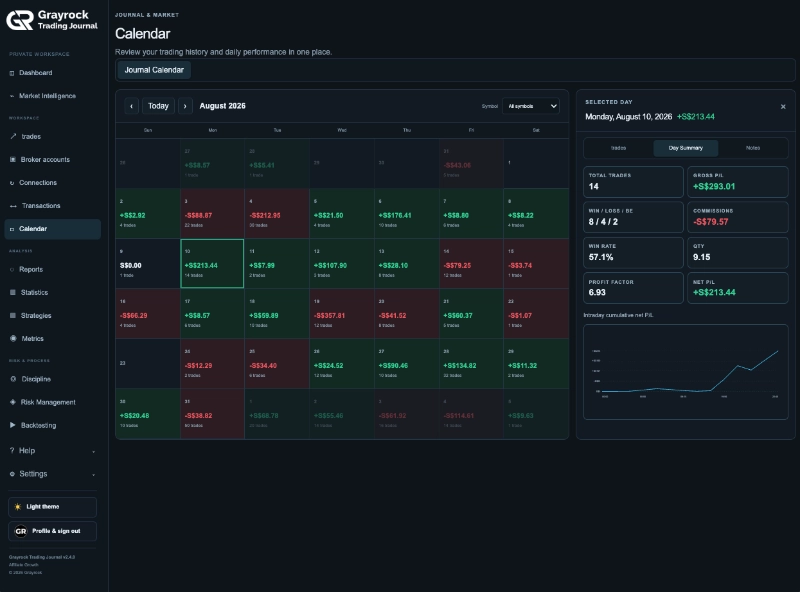
Bring individual trading days into one view. See each day’s displayed P/L and trade count, move between months and narrow the calendar to a selected symbol.
Review the Day Behind the Result.
Select a date to examine the records behind its total. Move between individual trades and the daily summary while keeping the month in view.
See Which Trades Contributed.
Review the selected day’s trade list, including instruments, buy or sell direction, quantities, displayed times and individual results. See how winning and losing trades contributed to the day.
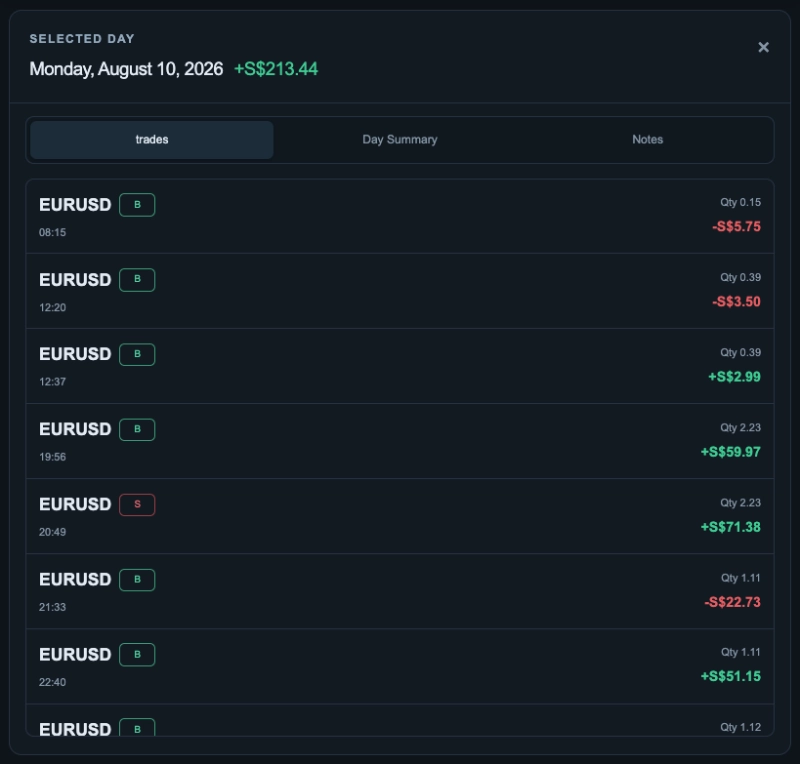
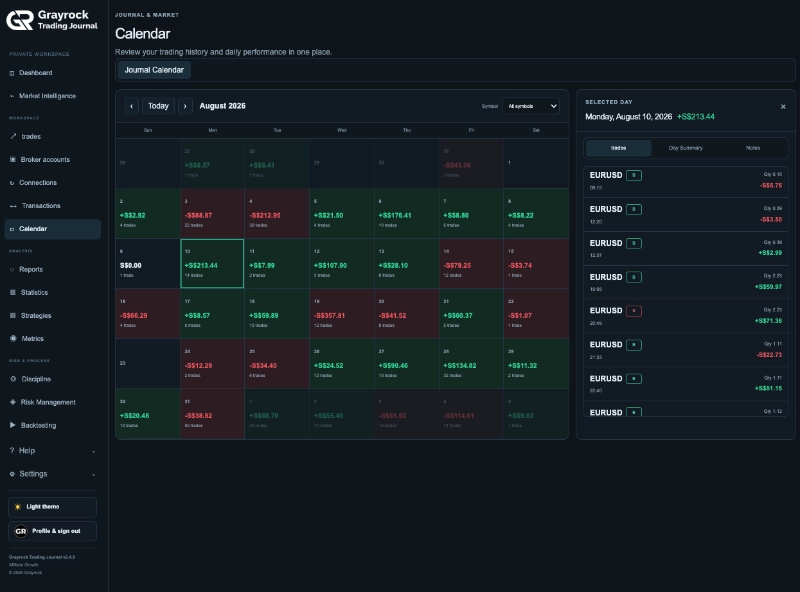
Day’s Trades
Select a date to see its individual trades alongside the monthly calendar. Review instruments, direction, quantity and results without losing the wider context.
Bring the Day’s Numbers Together.
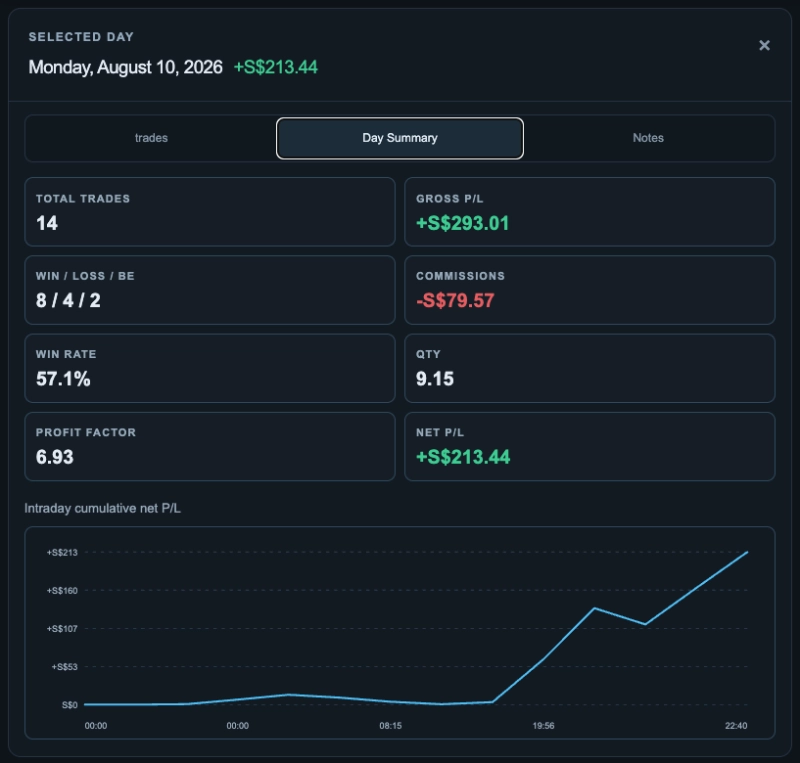
Review trade count, win/loss/breakeven totals, win rate and profit factor alongside gross P/L, commissions, quantity and net P/L. Follow the cumulative net P/L chart to see how recorded results accumulated during the day.
Day Summary
Review trade counts, outcomes, costs and net P/L beside the selected date. Follow the cumulative recorded net P/L chart to see how results developed through the day.
Keep Your Reflection With Your Trading Day.
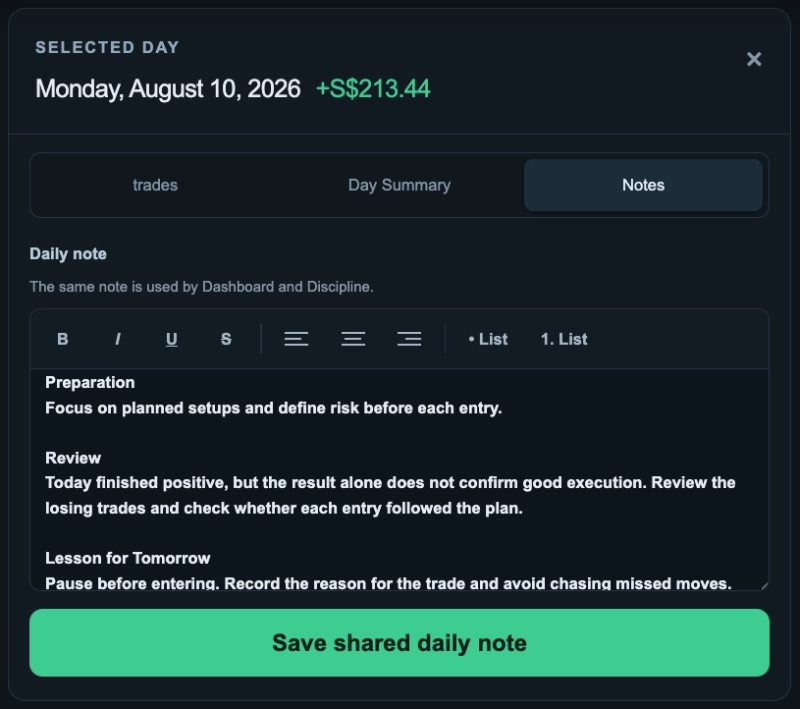
Record your preparation, observations and lessons in the selected date’s daily note. Return to that context when reviewing your results, with the same note available through Dashboard and Discipline.
About the Trading Calendar
Understand how to review daily results, explore trading records and keep your reflections connected.
What does the Trading Calendar show?
The monthly view displays daily trading results and trade counts from your recorded journal history. Select a date to review its trades, daily summary and shared note.
Can I review previous months?
Yes. Use the previous and next month controls to browse your history. The Today button returns you to the current month.
Can I filter the calendar by symbol?
Yes. Use the symbol selector to focus on one instrument or view all symbols.
What can I see when I select a date?
The selected-day panel contains three tabs: Trades, Day Summary and Notes. These let you examine individual records, review combined daily figures and maintain your daily reflection.
Which figures appear in Day Summary?
The summary includes total trades, win/loss/breakeven counts, win rate, profit factor, gross P/L, commissions, quantity and net P/L, together with a cumulative net P/L chart.
Does the daily chart show live equity?
No. It shows cumulative recorded net P/L for the selected day. It does not reconstruct unrealised price movements or live open-position exposure.
Are Calendar notes separate from Discipline notes?
No. The daily note is shared with Dashboard and Discipline, so you can work with the same reflection across those areas.
How are daily notes different from trade notes?
Daily notes capture context for the date as a whole. Trade notes belong to individual records in the Trade Journal, where you can also attach chart images.
How is the Calendar different from Reports?
The Calendar organises your review around months and individual days. Reports provides broader views of performance, outcomes, drawdown and trading patterns across a selected journal sample.
Make Daily Review Part of Your Trading Routine.
See the month, examine the day and keep the context that helps you review your recorded results.