

Understand How Your Trading Results Were Produced.
Explore your recorded trading results through detailed statistics, visual trends and comparisons by tag and session. Review outcomes alongside trading activity and drawdown to give your performance more context.
- Detailed trading statistics
- Performance trends
- Tag and session comparisons
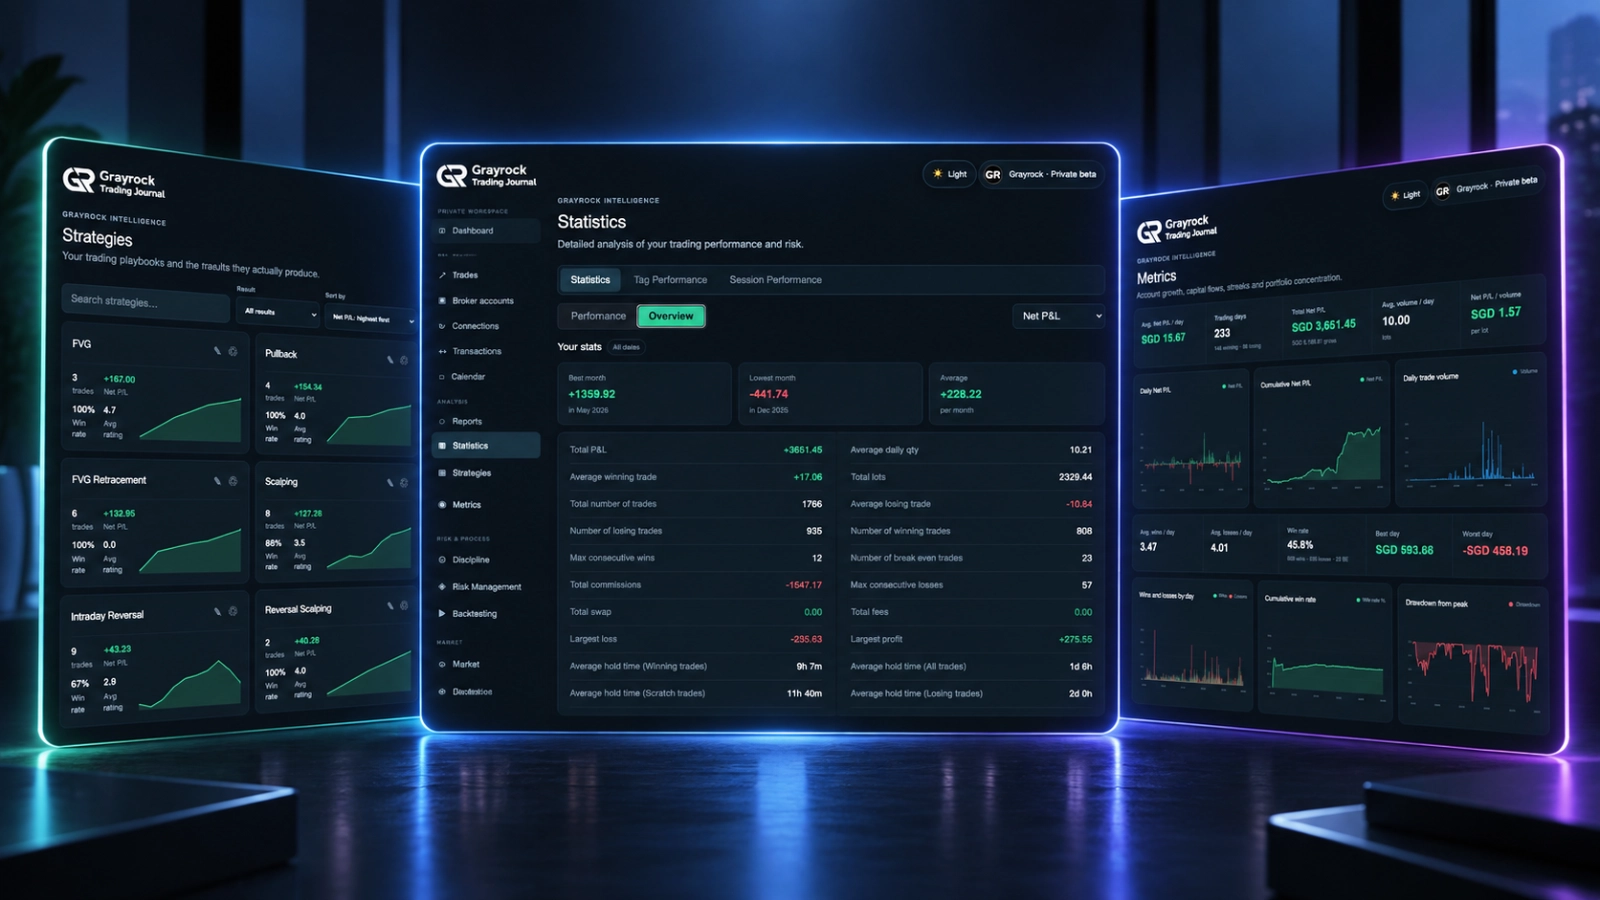
Start With the Result. Examine the Details.
Review your overall P/L alongside winning and losing trades, trading costs, holding times and drawdown. Switch between a detailed overview and a compact performance summary.
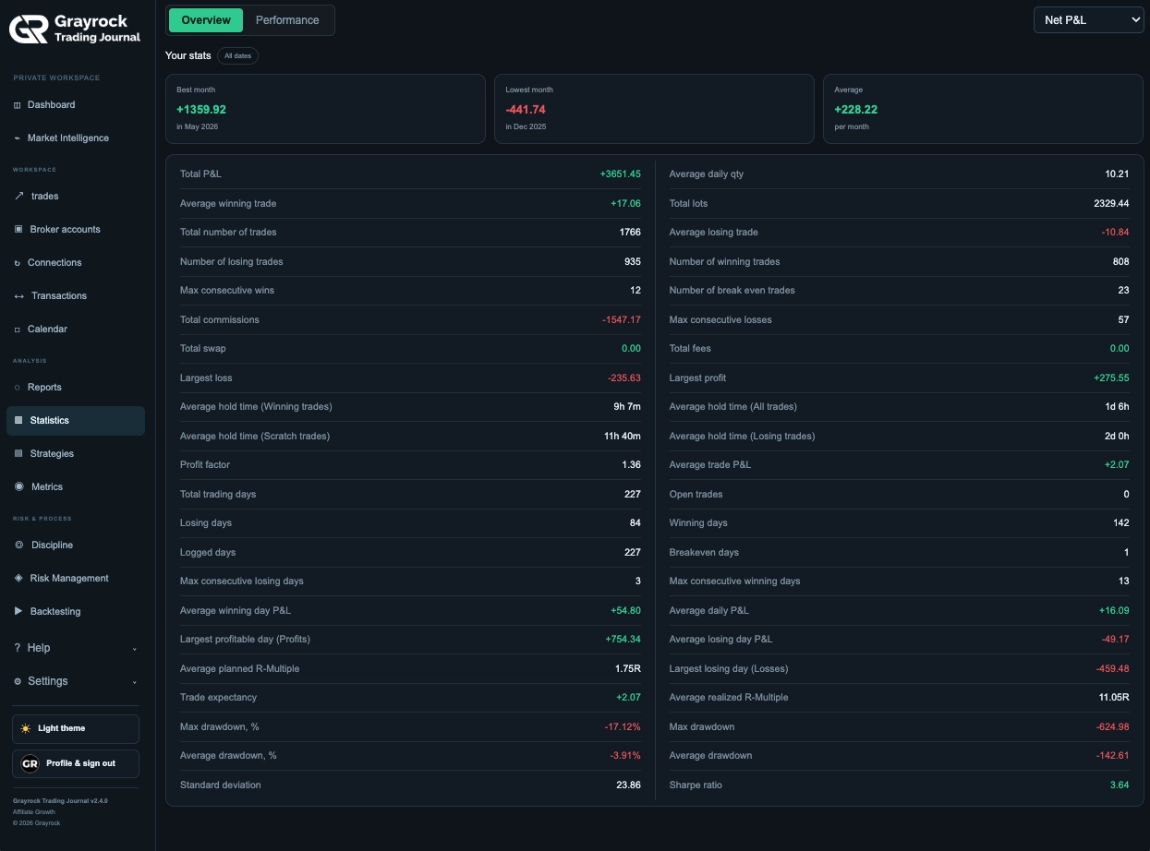
Bring the Details Into One View.
Examine trade counts, average wins and losses, commissions, streaks and holding times. Review these figures together to understand more about the results recorded in your journal.
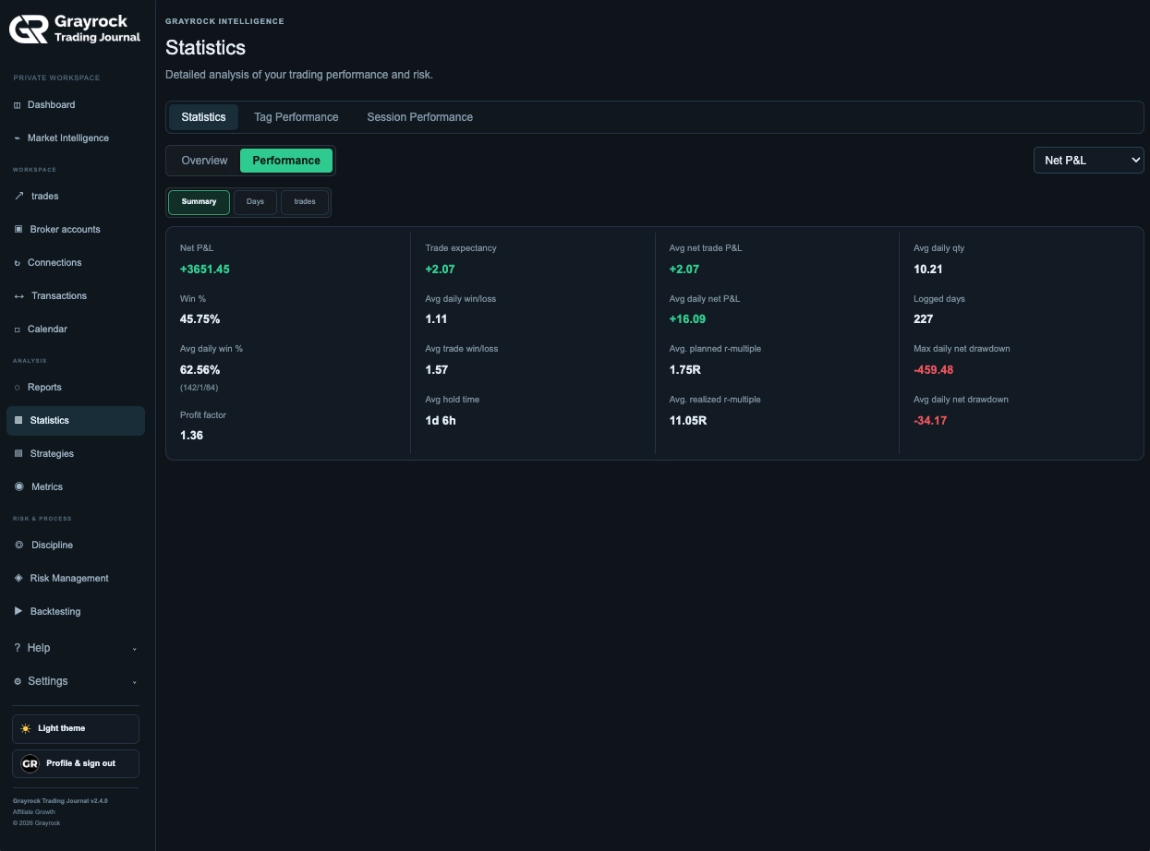
Keep Key Measures Together.
Review net P/L, win rate, profit factor, trade expectancy and average trade results in a compact summary. Compare trade-level and daily measures without working through the full statistics table.
See How Your Recorded Results Develop.
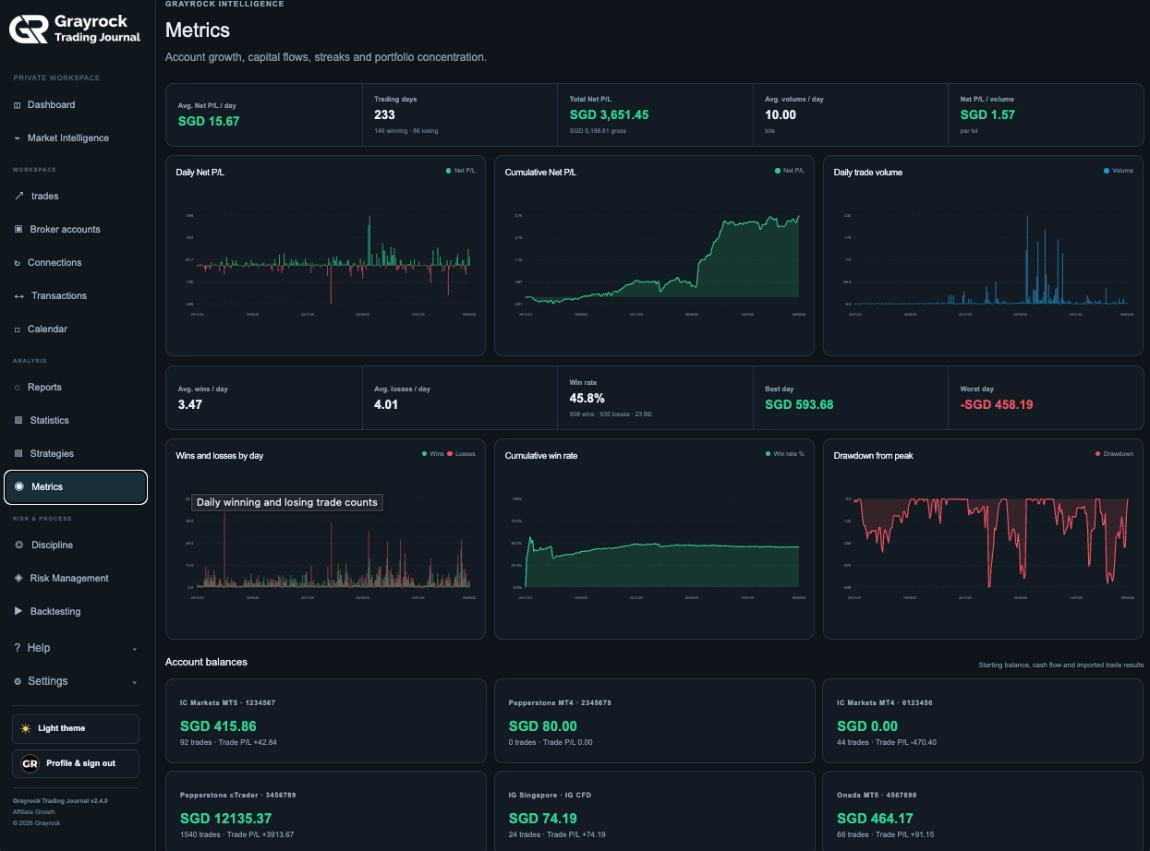
Individual figures show one part of your performance. Charts help you examine how results, trading activity and drawdown change across your recorded history.
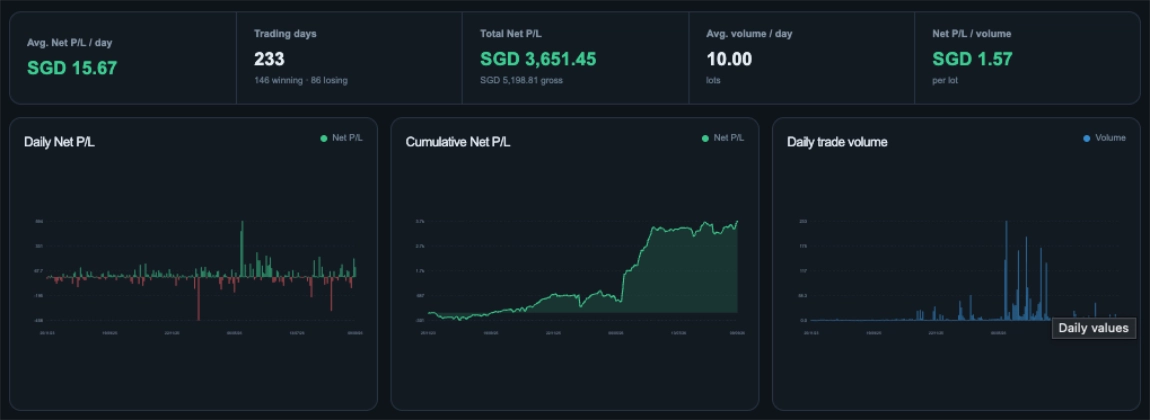
Review Results Alongside Trading Activity.
See daily profits and losses, follow cumulative net P/L and compare trading volume across the same history.
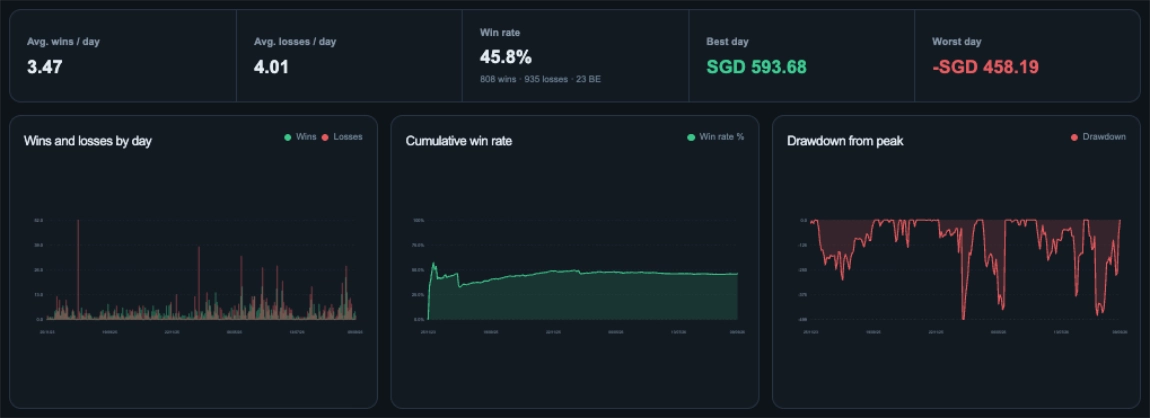
Follow Wins, Losses and Drawdown.
Review daily winning and losing trade counts, the development of cumulative win rate and declines from previous peaks.
Compare the Groups Behind Your Results.
Explore how recorded results differ across trade tags and sessions. Read P/L alongside trade counts, win rate and expectancy to give each comparison context.
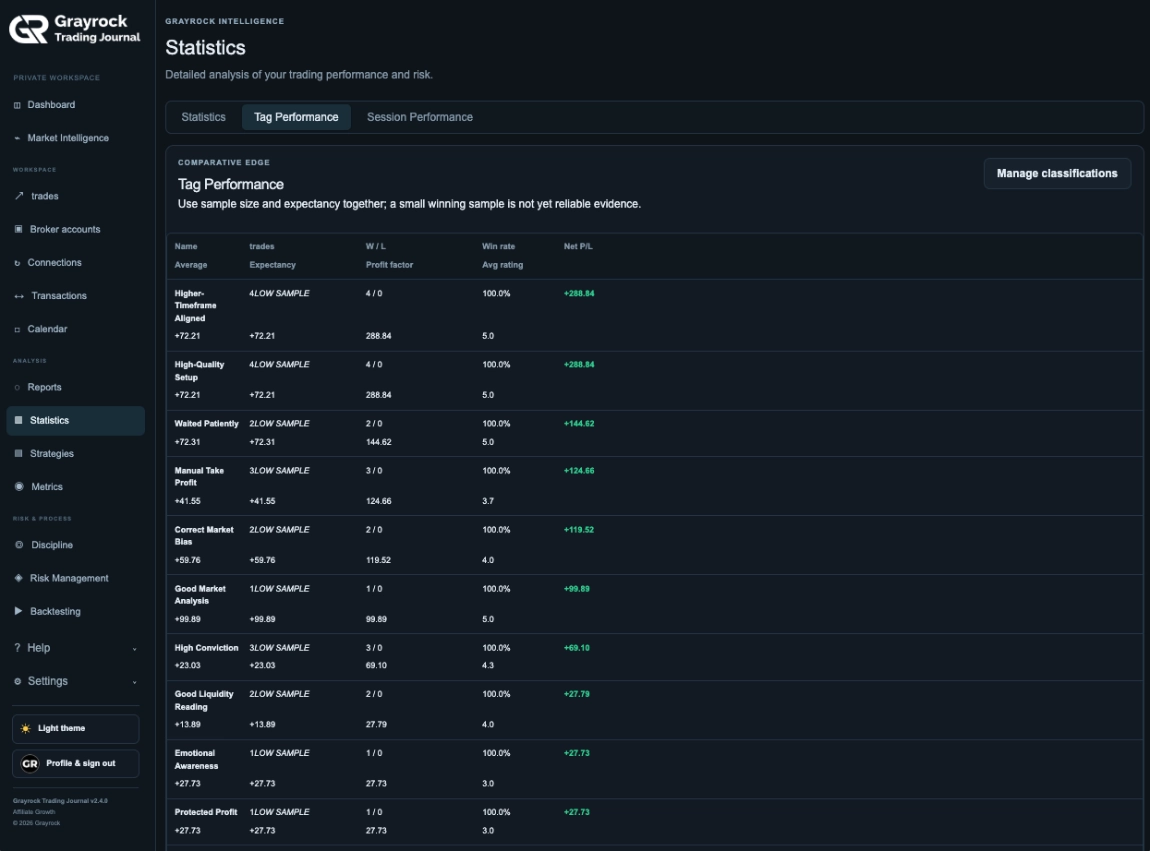
Review Trades With Shared Classifications.
Compare groups of tagged trades using their recorded outcomes. See trade counts, wins and losses, net P/L, expectancy and average ratings together.
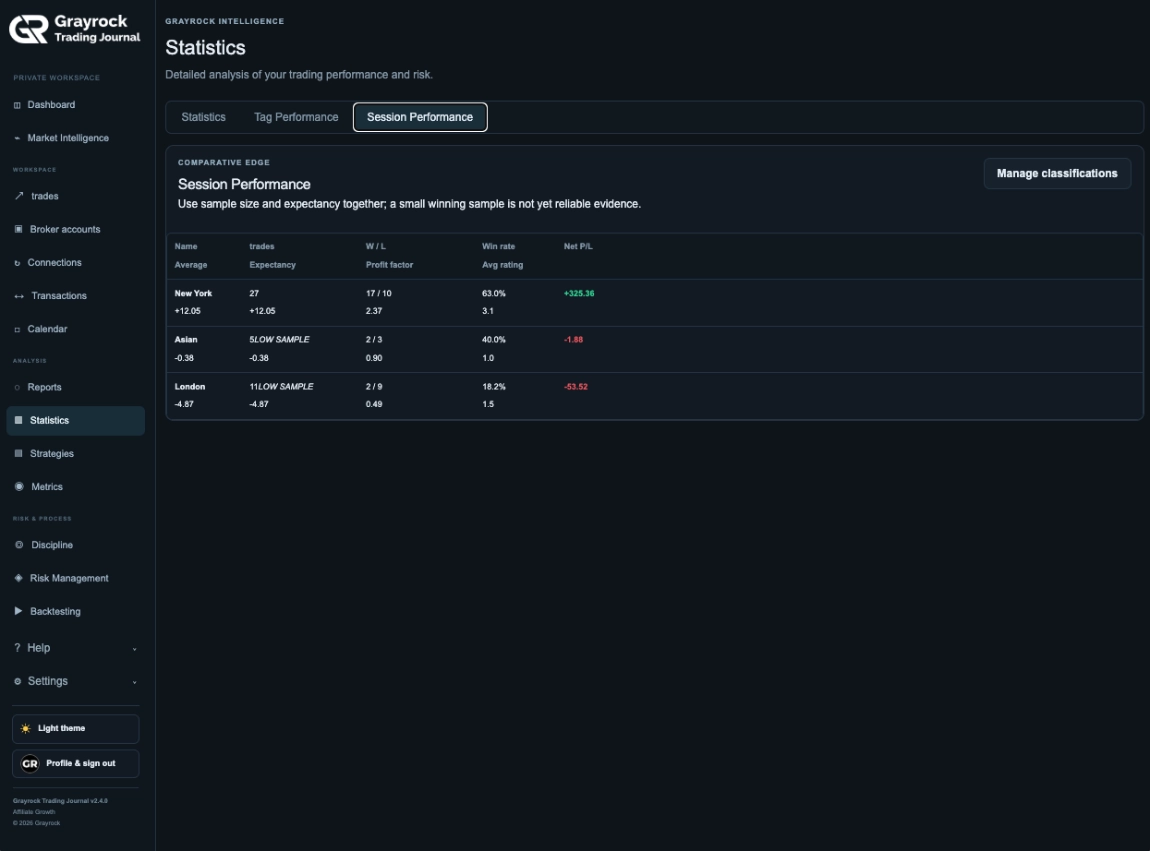
Compare Your Recorded Trading Sessions.
Review the trades assigned to each session and compare their results. Use sample sizes alongside performance figures when examining differences between sessions.
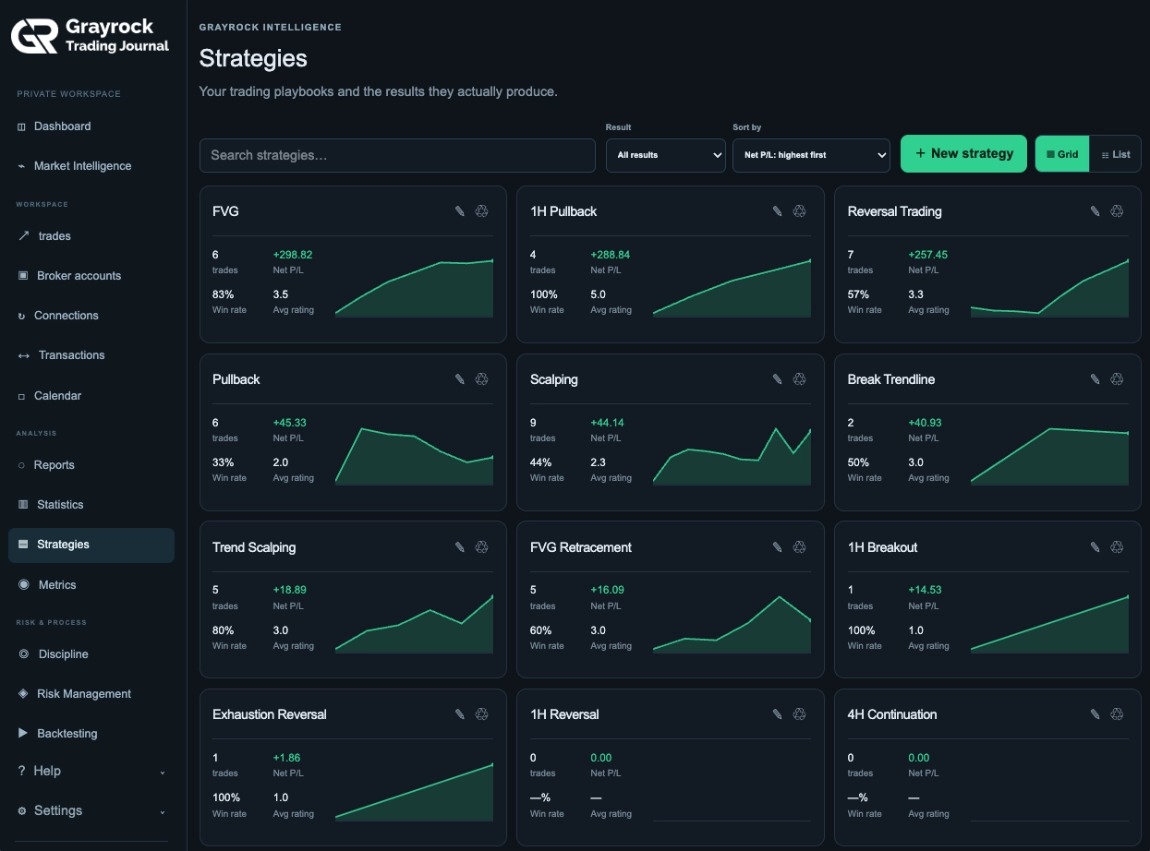
See How Your Recorded Strategies Compare.
Review the results associated with the strategies assigned to your trades. Compare trade counts, net P/L, win rates and average ratings alongside each strategy’s result chart.
Use these measures together when reviewing your trading methods. A strong result from a small number of trades needs more context before you treat it as a consistent pattern.
Keep Account Balances Beside Your Trading Results.
Review the account balances shown in your journal alongside each account’s recorded trade count and trade P/L.
Balances can reflect starting funds, cash flows and imported trade results. Read the balance and trading contribution together when reviewing each account.
About Performance Analytics
Understand the views available and how to read your recorded results in context.
What does Performance Analytics show?
It brings together detailed trading statistics, performance summaries, charts and comparisons by tag and session. These views help you examine the trading history recorded in your journal.
What is the difference between Statistics and Metrics?
Statistics presents detailed figures and a compact performance summary, with additional views for tag and session comparisons. Metrics presents charts of results, trading activity, win rate and drawdown, alongside account balances.
Can I compare performance by trade tag?
Yes. Tag Performance groups tagged trades and displays measures including trade count, wins and losses, win rate, net P/L and expectancy.
Can I compare trading sessions?
Yes. Session Performance displays results for trades assigned to your recorded sessions. Review the number of trades alongside each session’s performance figures.
What does the low-sample label mean?
It highlights a group with a limited number of recorded trades. Strong results from a small group may not represent a consistent pattern, so consider the sample size before drawing conclusions.
Does cumulative net P/L show my account balance?
Cumulative net P/L and account balance describe different things. The chart follows recorded net trading results, while account balances can also reflect starting funds and cash flows.
Where do I manage my trade tags and sessions?
Manage your reusable library in Classifications & Sessions, then apply the relevant classifications to your trades.
How is this different from Reports?
Performance Analytics focuses on statistics, charts and recorded group comparisons. Reports provides a structured review of your selected journal sample across its report views.
Do these results predict future performance?
No. These views describe recorded trading history. Their usefulness depends on the completeness and accuracy of your records, and historical results do not guarantee future outcomes.
Can I compare my trading strategies?
Yes. The Strategies view shows trade counts, net P/L, win rates, average ratings and result charts for trades assigned to your strategies. Consider the number of recorded trades alongside each strategy’s results.
Turn Your Trading History Into Evidence You Can Review.
Explore the figures, trends and recorded groups behind your results. Give your next journal review a clearer starting point.