

See Where You Earn. Understand Where You Spend.
Explore your income sources and spending categories in one clear view. Compare periods, examine category totals and review the records behind your personal and business activity.
- Income & spending breakdowns
- Period comparisons
- One currency at a time
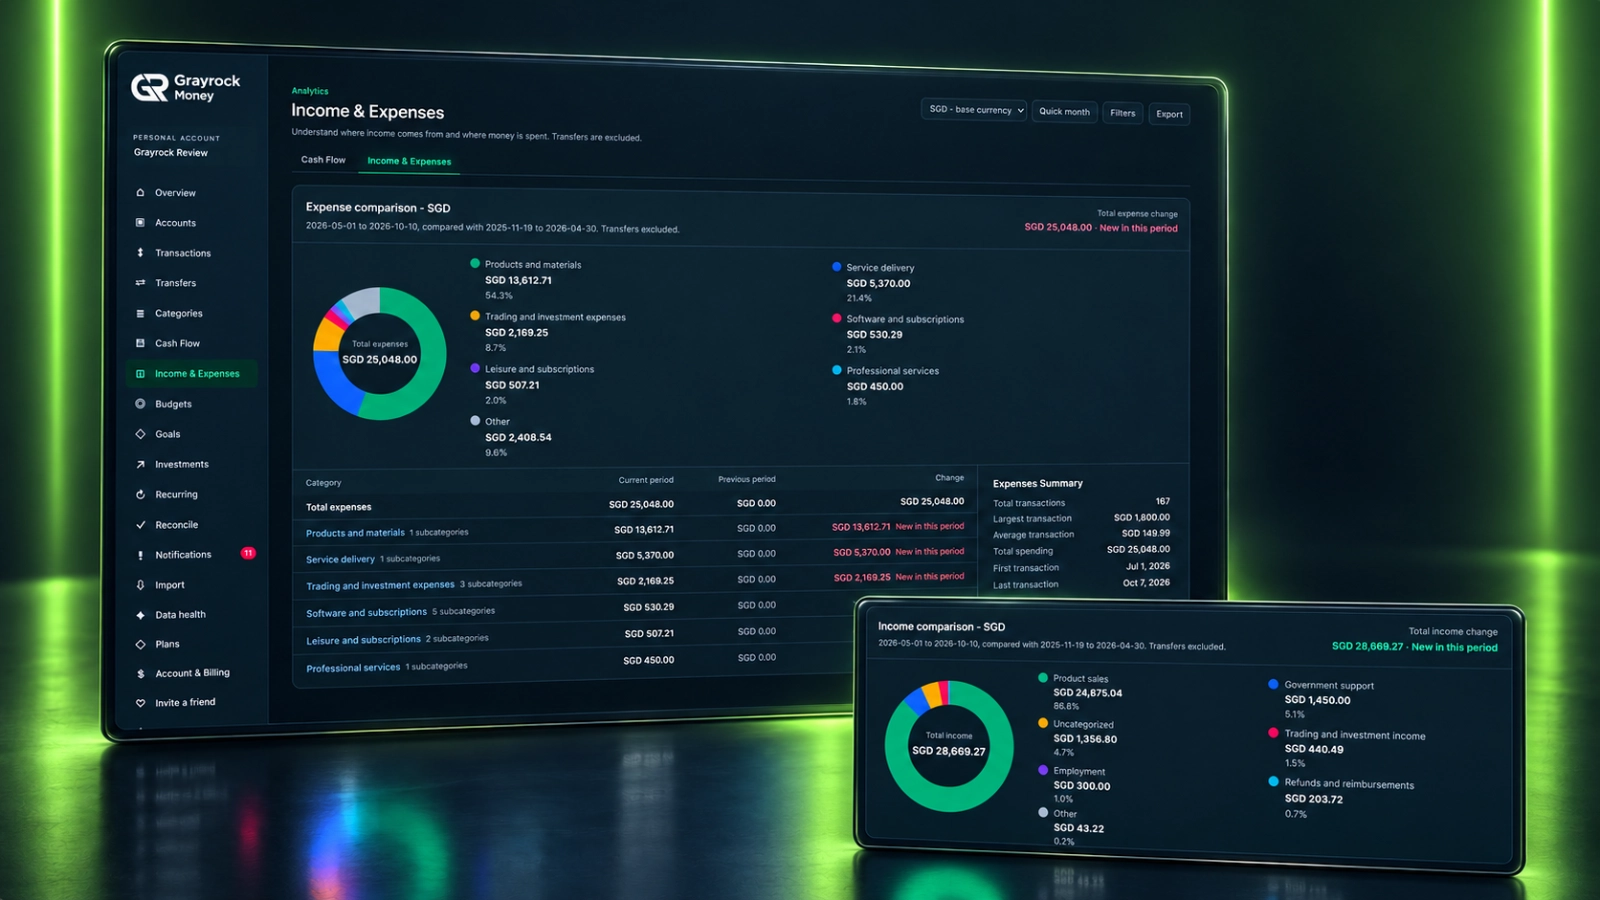
Understand What Makes Up Your Money Activity.
See the categories contributing to your income and expenses, then compare their amounts and share of the total.
Explore Income Sources
Review the categories contributing to your recorded income, from employment to product sales and other sources.
Understand Your Spending
See how expenses are distributed across categories, with amounts and percentages alongside the chart.
Compare Periods
Review current and previous period amounts to see which categories have changed.
Inspect the Details
Explore category and subcategory activity, then review the transactions behind the figures.
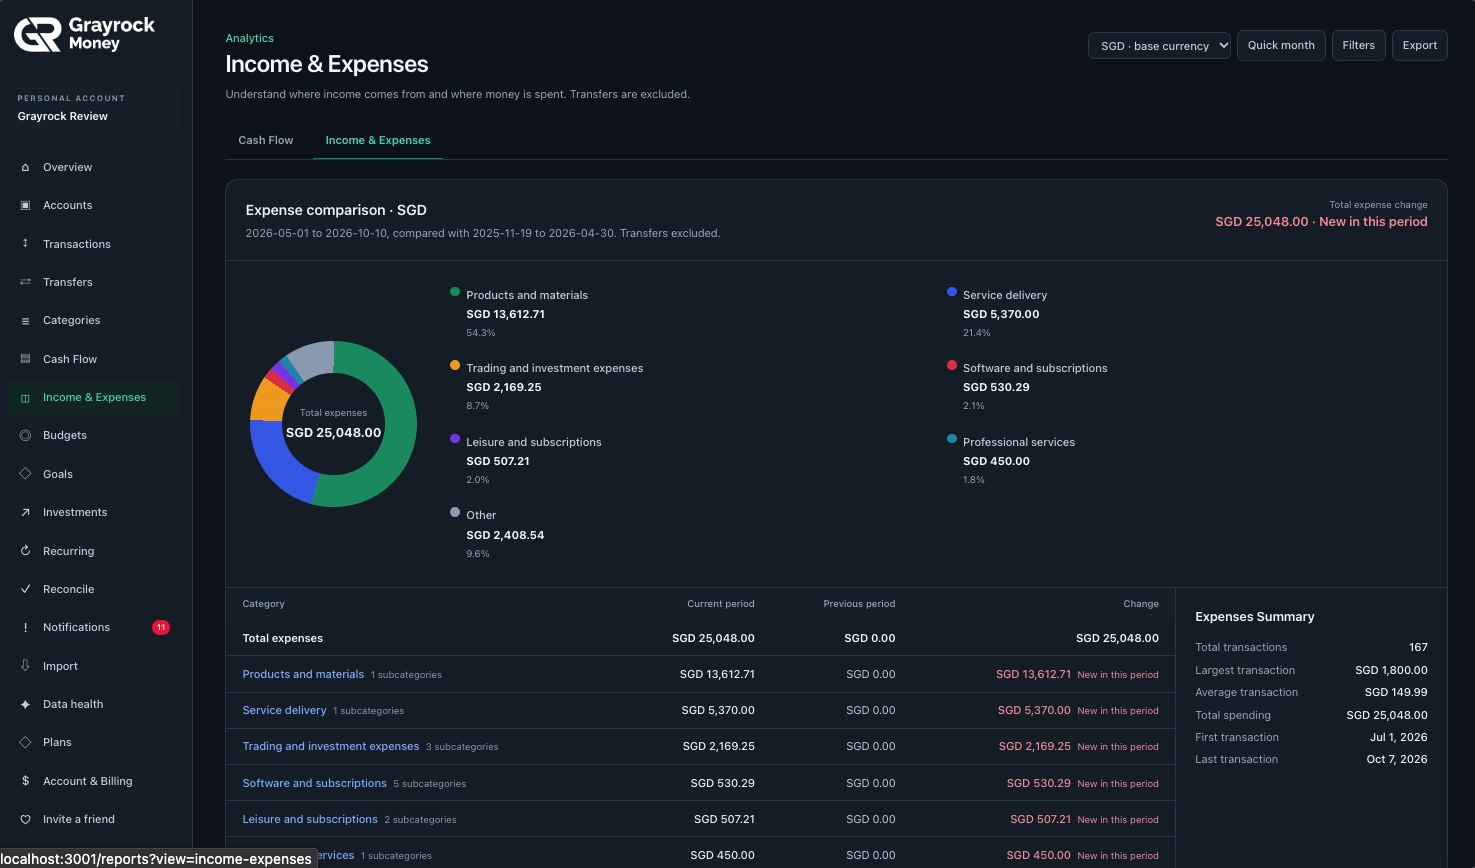
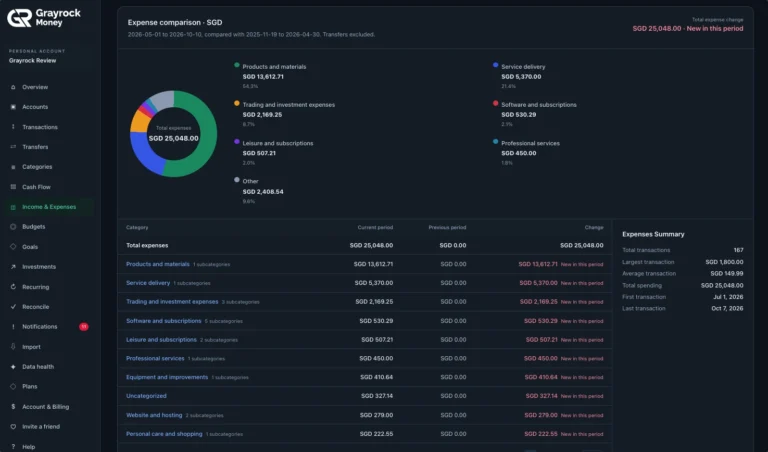
Compare Expenses by Category
Compare spending categories and review changes between periods.
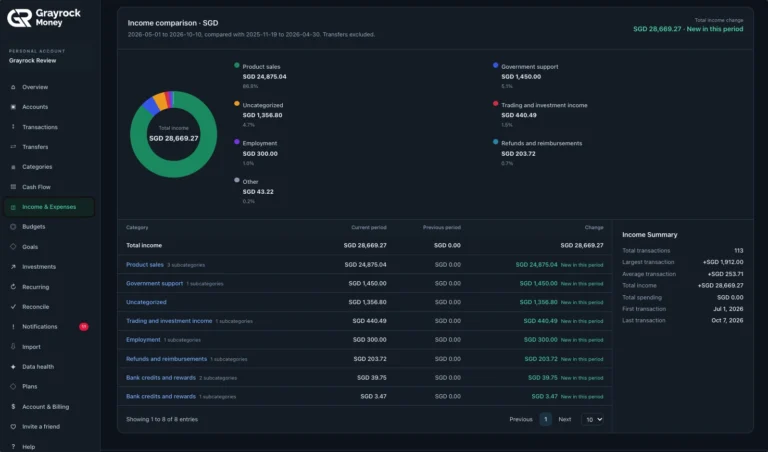
Compare Income Sources
Understand which categories contribute to your recorded income.
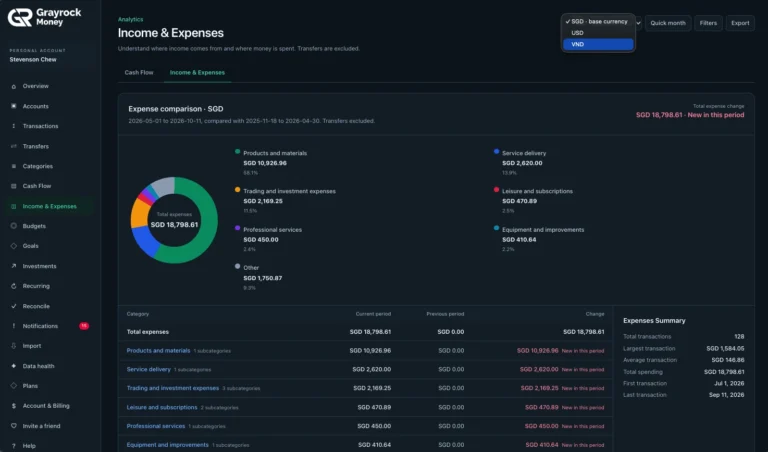
Select a Report Currency
Review income and expenses in one currency at a time.
See the Breakdown. Follow the Records.
Start with the visual breakdown, then use the comparison table and transaction summary to understand the activity behind each report.
Read the Category Mix
Review Transaction Summaries
Choose Your Currency
Compare the Periods Behind the Figures.
Read the current amount alongside the previous period before interpreting a change. The report shows the date ranges being compared.
Current Period
See the recorded income or expenses within the period you are reviewing.
Previous Period
Check the comparison period and its category amounts to understand the starting point.
Category Change
Review the difference between periods to identify categories that deserve a closer look.
Explore Your Income and Spending in Three Steps.
About Income & Expenses
Understand the breakdowns, comparisons and transaction summaries behind your report.
What does the Income & Expenses page show?
It shows separate income and expense breakdowns, including category amounts, percentages, period comparisons and transaction summaries.
How is this different from the Cash Flow page?
Cash Flow focuses on income, expenses, net cash flow and monthly balance trends. Income & Expenses provides a closer look at the categories behind earning and spending, including comparisons between periods.
Can I compare spending with a previous period?
Yes. The expense comparison table shows current and previous period amounts and their change. The report displays the date ranges used for the comparison.
Can I review income sources as well as expenses?
Yes. The income comparison provides its own category chart, comparison table and transaction summary.
What does “New in this period” mean?
It indicates a current recorded amount with no amount in the comparison period. This can reflect new activity or differences in the records available, so check the underlying transactions.
Are transfers included in income and expenses?
No. Transfers between accounts you own are excluded, so moving existing money does not count as new income or spending.
Are different currencies converted into my base currency?
No. The report reviews one currency at a time. Selecting your base currency changes the view; it does not convert transactions recorded in other currencies.
Can I inspect the transactions behind a category?
Yes. Explore the category and subcategory details to review the activity behind the report totals.
Give Your Income and Spending More Context.
Explore the sources, categories and records behind your financial activity with Grayrock Money.