

Understand What Is Behind Your Trading Results.
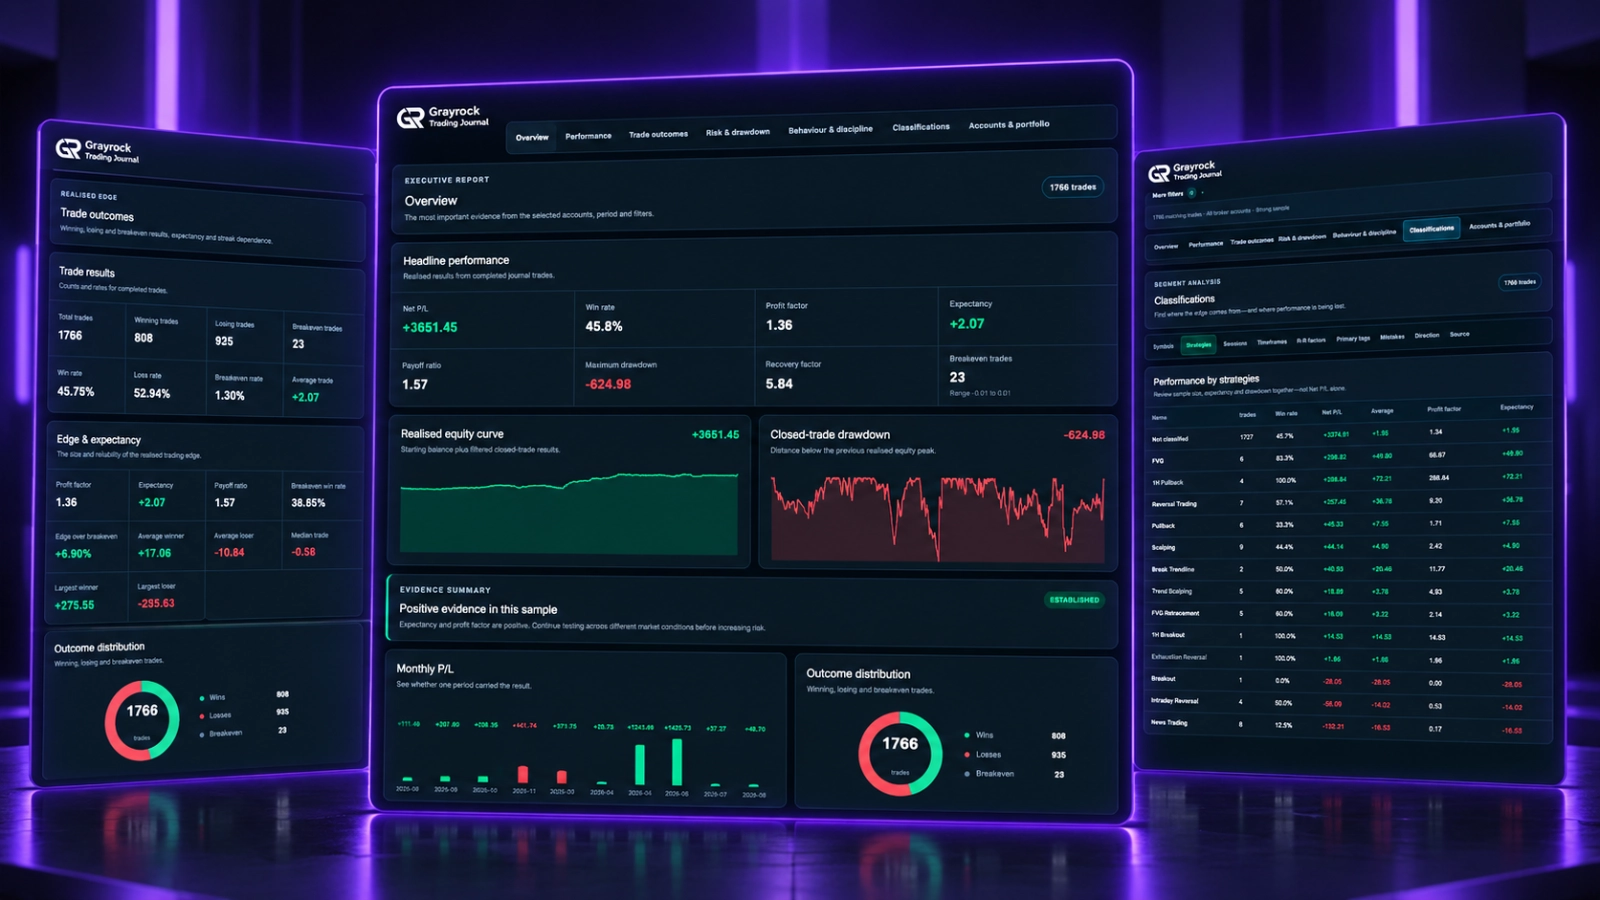
Review performance, trade outcomes, drawdown and trading patterns across seven focused report views. Bring your recorded journal evidence together to examine where results came from and what deserves closer review.
- Seven focused report views
- Filter by account, period and symbol
- Evidence from completed journal trades
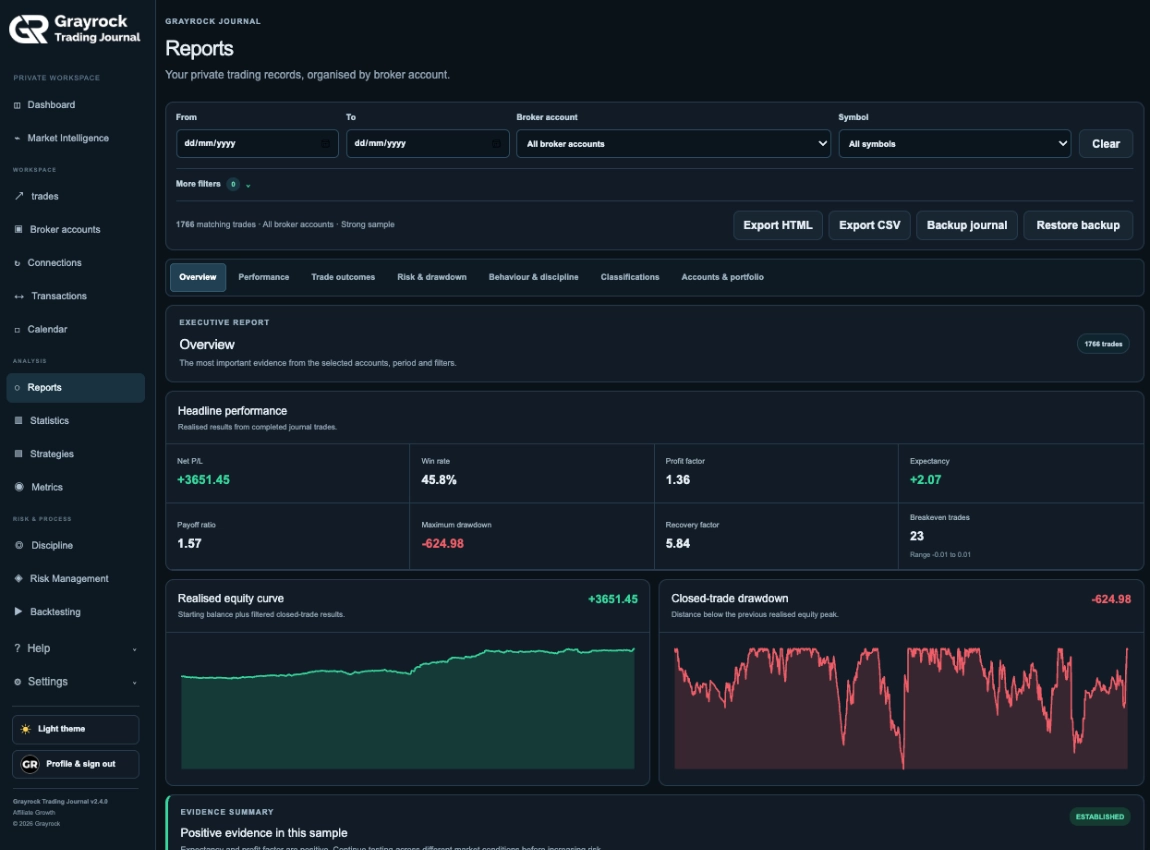
Start With the Records You Want to Understand.
Choose a date range, broker account and symbol to define your report sample. Check the matching-trade count before comparing results, then explore the different report views within that selected scope.
Move From the Headline Result to the Evidence Behind It.
Review the same journal sample from different angles. Start with the overview, then explore returns, outcomes, drawdown, behaviour, classifications and account contributions.
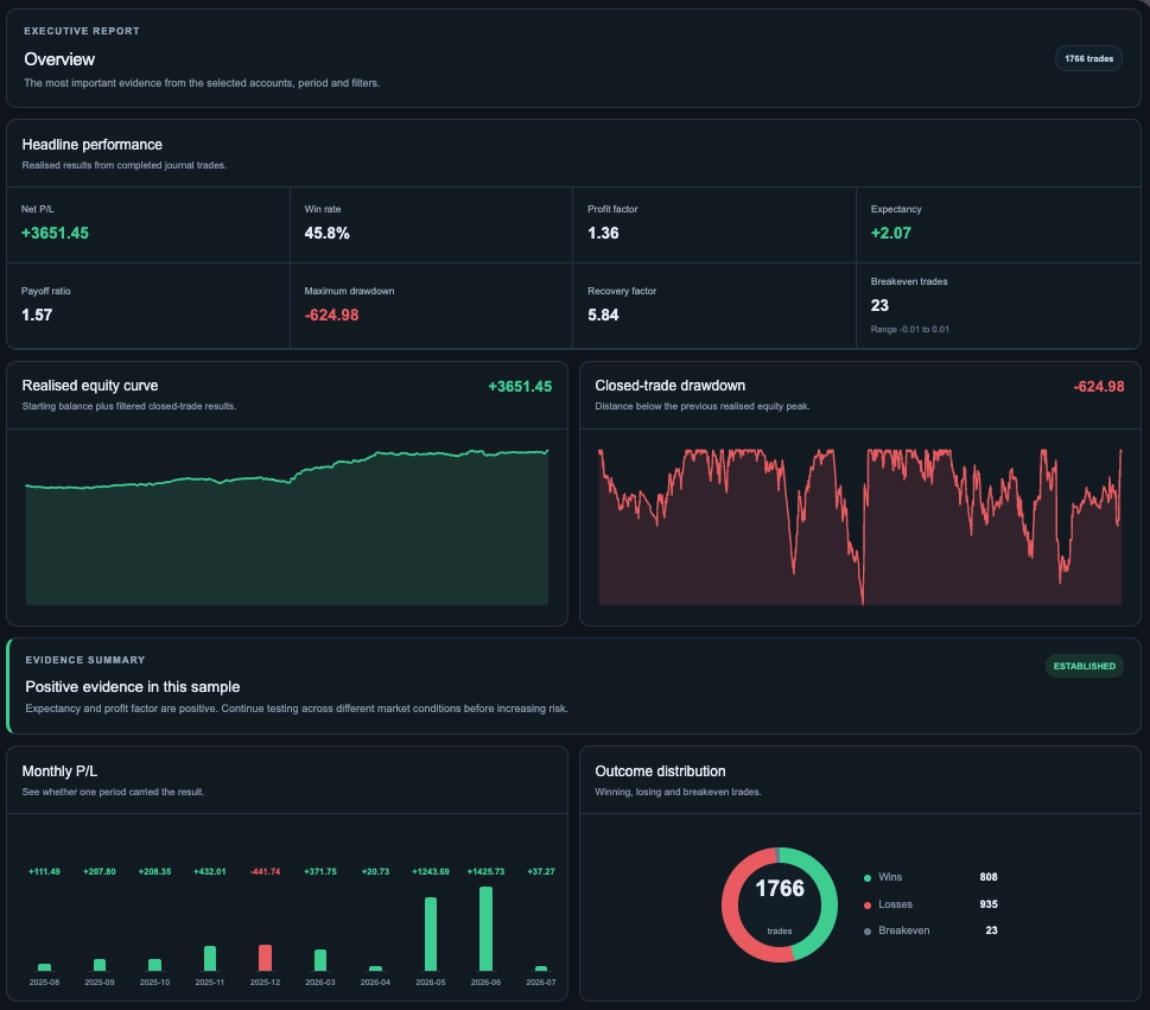
See the Main Results Together.
Bring Net P/L, win rate, profit factor, expectancy and drawdown into one view. Review realised equity, monthly results and the distribution of winning, losing and breakeven trades alongside the sample’s evidence summary.
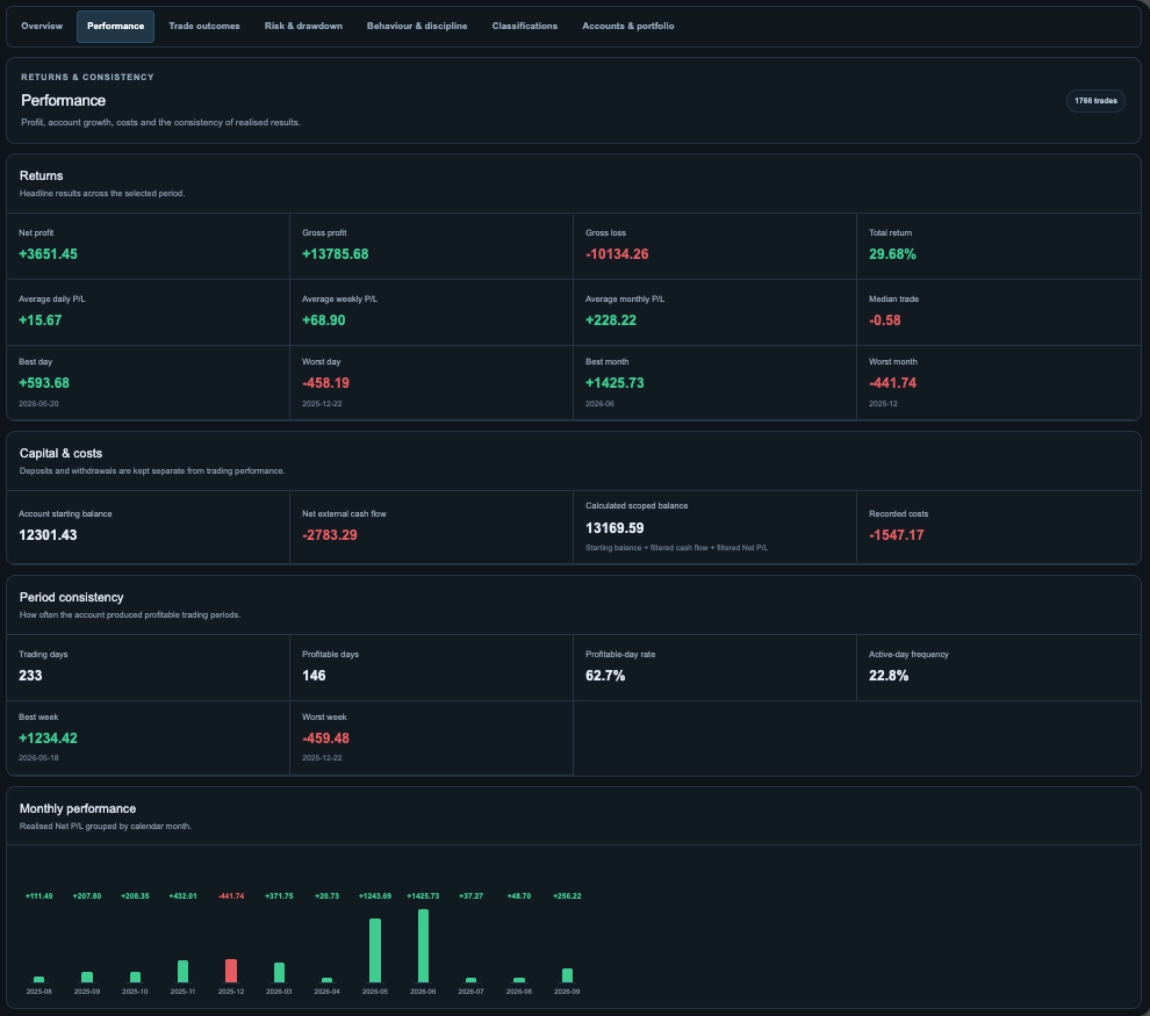
Examine Returns, Costs and Consistency.
Review net results, average daily, weekly and monthly P/L, and the strongest and weakest recorded periods. Examine trading costs and capital-flow context alongside profitable-day frequency and monthly performance.
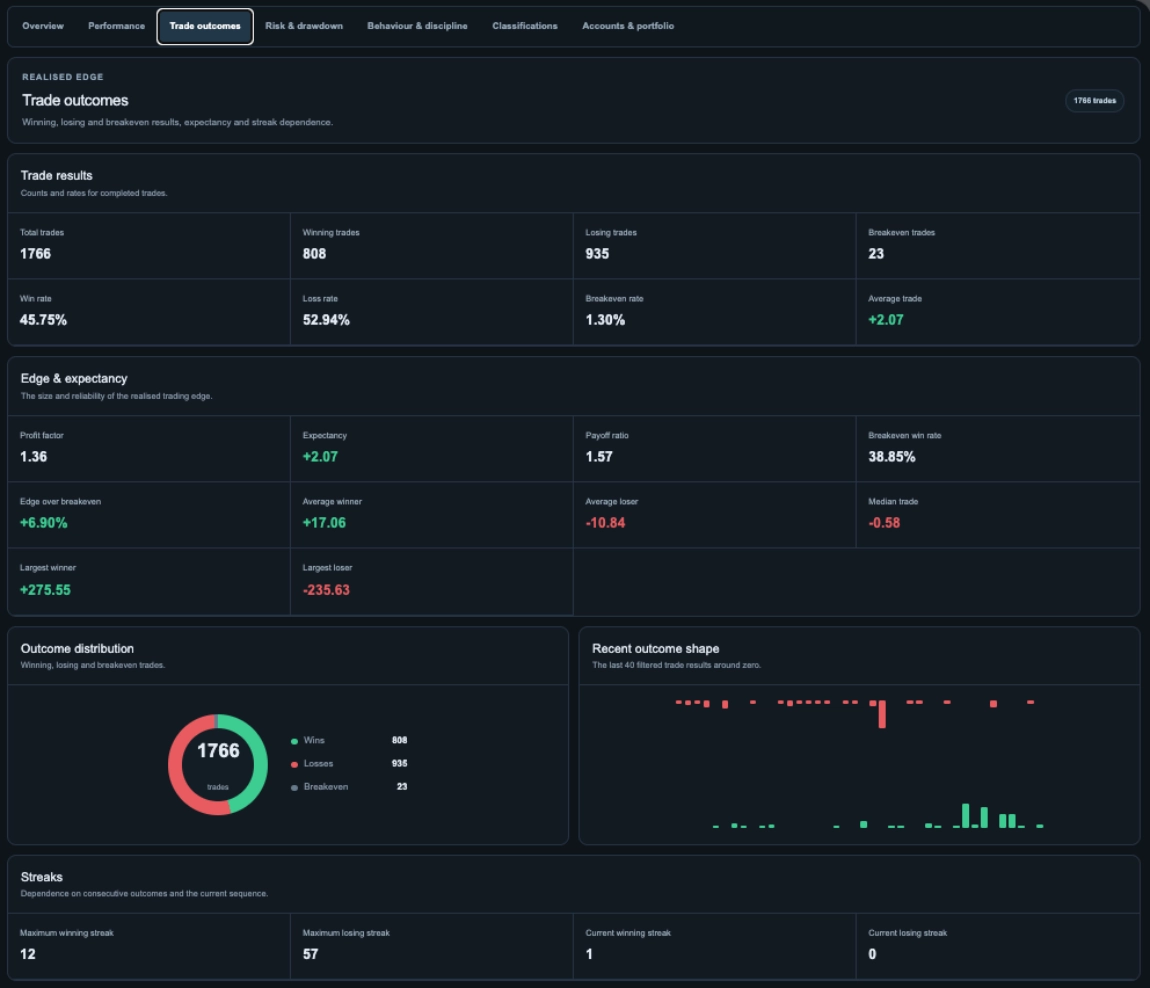
Look Beyond Win Rate.
Compare winning, losing and breakeven trades with expectancy, profit factor and payoff ratio. Review average and extreme outcomes, recent result patterns and consecutive winning or losing streaks.
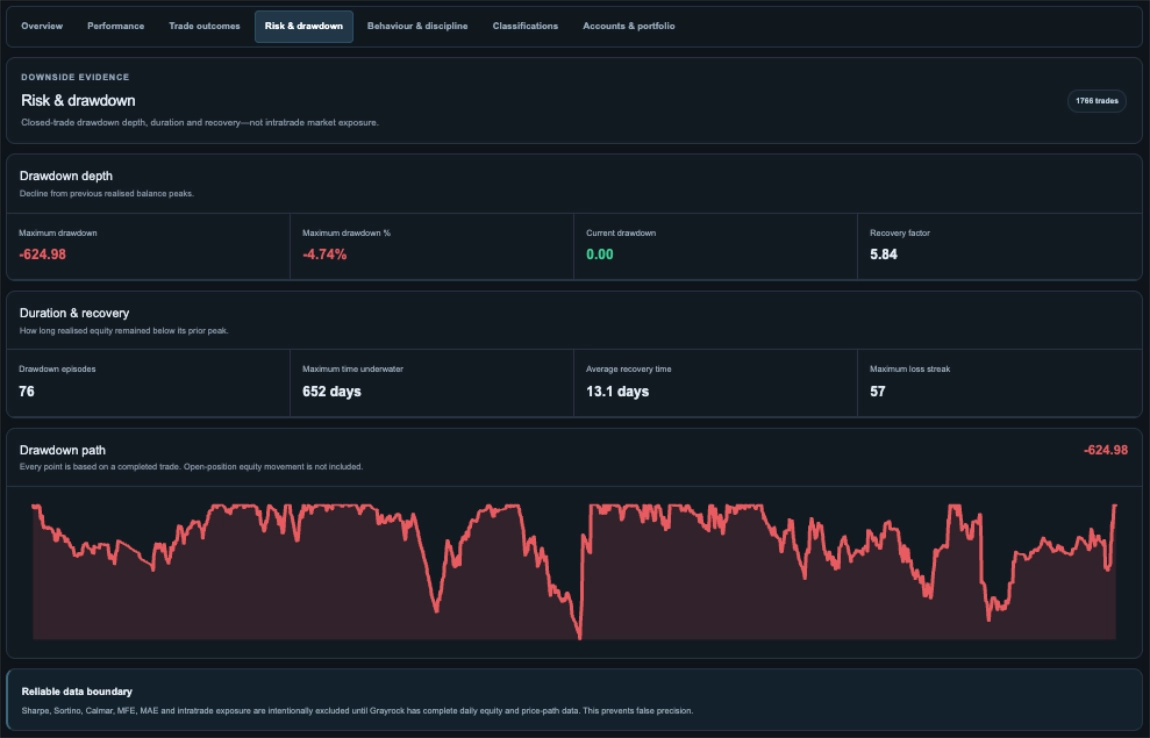
Review the Depth and Duration of Recorded Drawdown.
Examine maximum and current drawdown, recovery factor, drawdown episodes and time spent below previous realised equity peaks. Follow the drawdown path produced by completed trades.
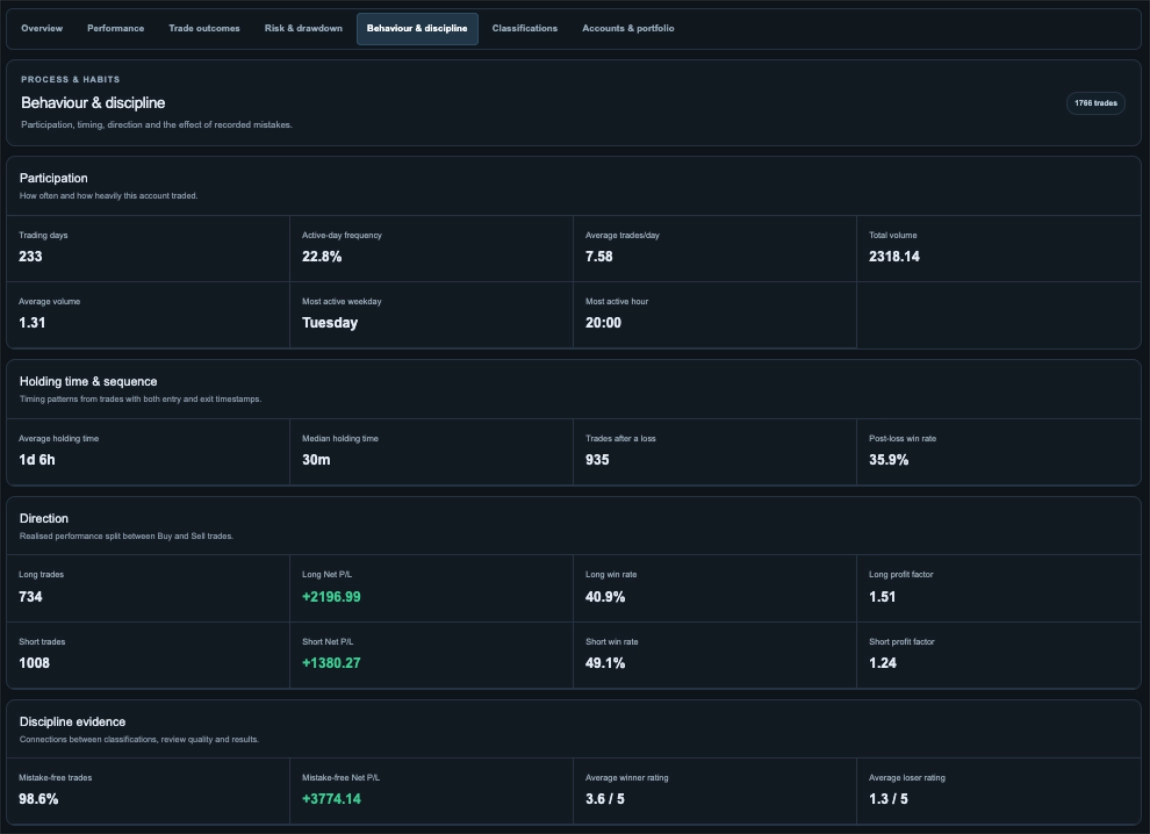
Examine the Patterns Around Your Results.
Review trading frequency, activity timing, holding periods and outcomes following losses. Compare long and short results, then examine the recorded mistakes and trade ratings available in your journal.
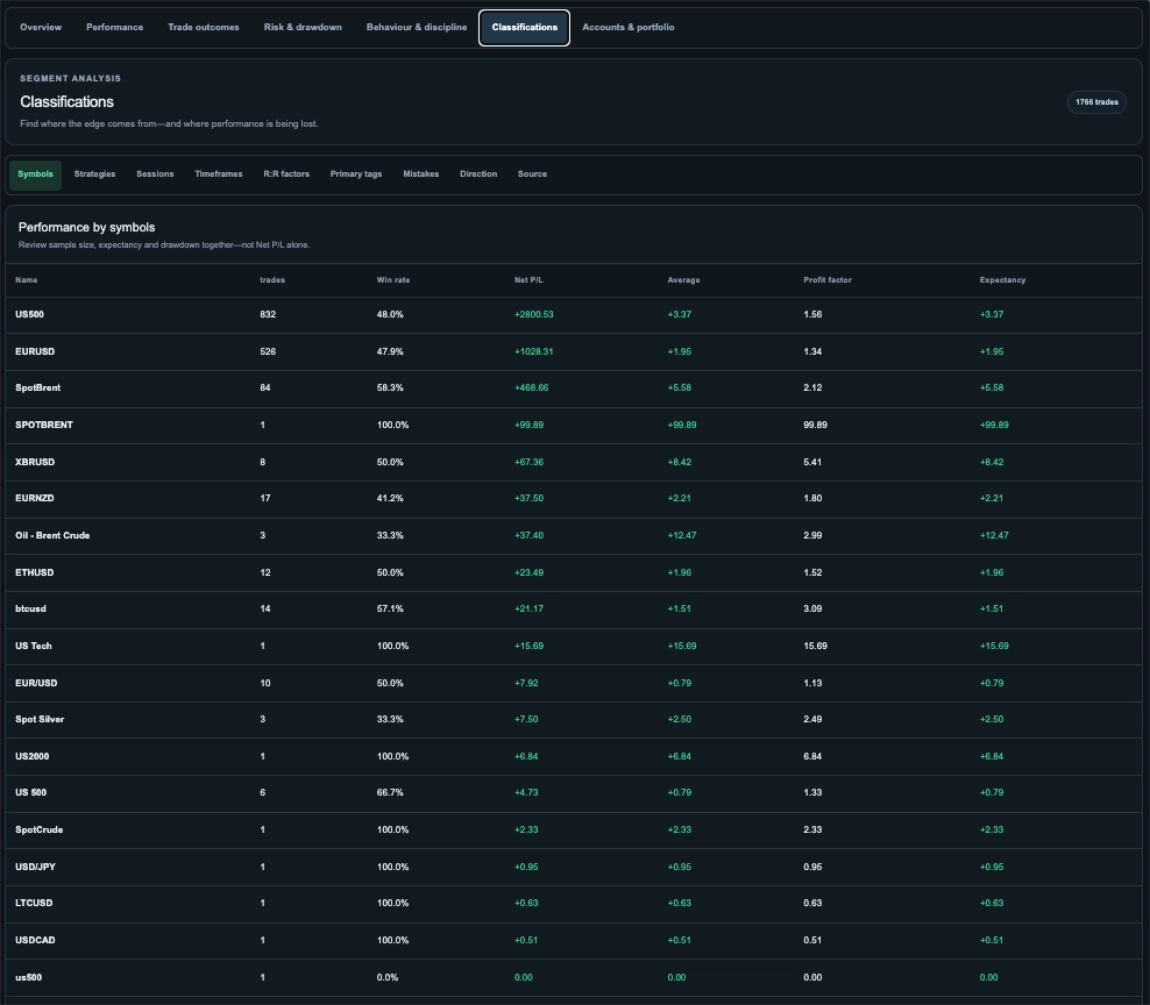
Compare the Context Behind Your Trades.
Break down results by symbols, strategies, sessions, timeframes, R factors, primary tags, mistakes, direction and source. Compare trade counts, win rates, Net P/L, average results, profit factor and expectancy across the recorded groups.
See Which Accounts and Markets Contributed.
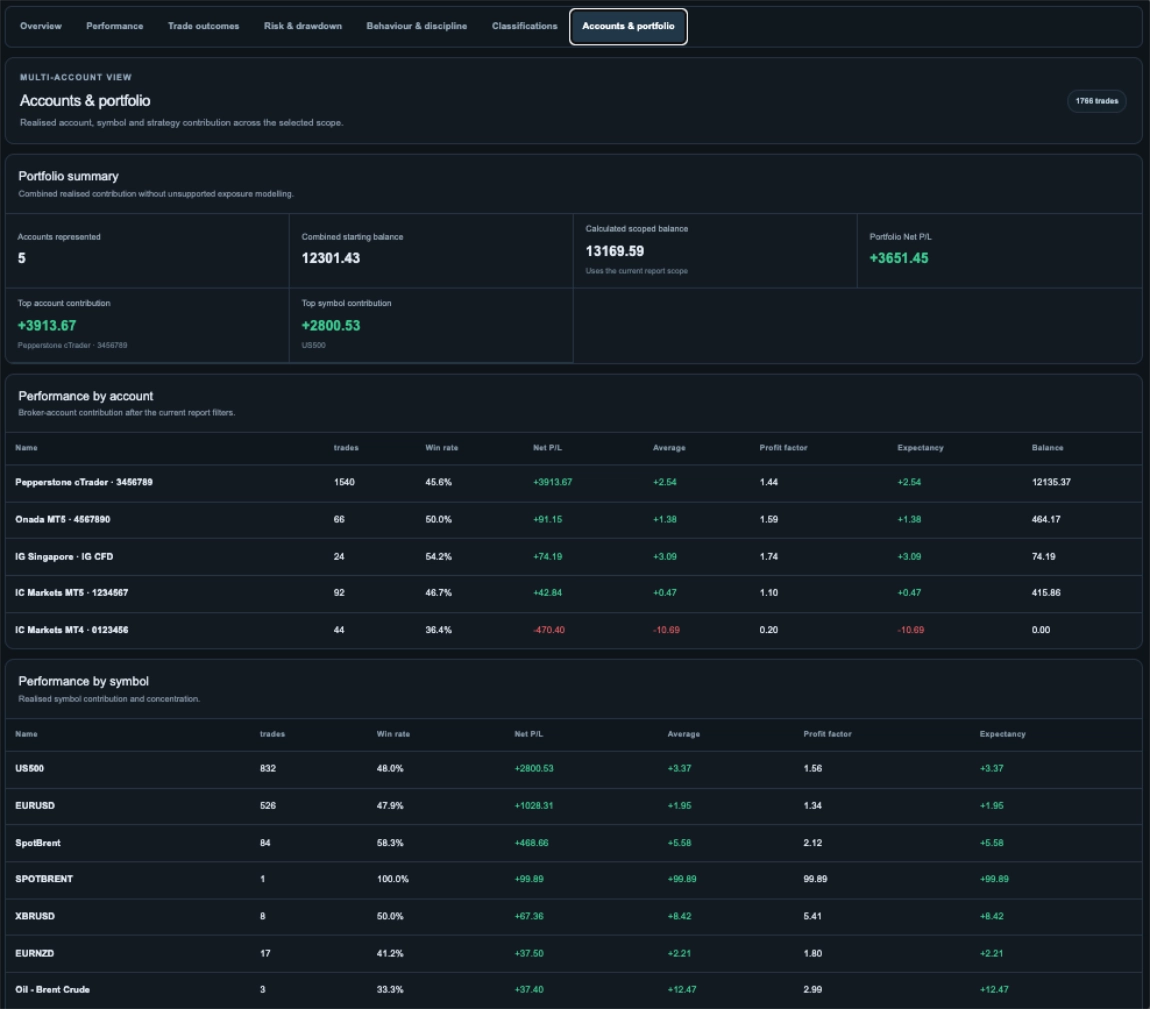
Review the accounts represented in your selected sample and compare their recorded contributions. Examine account-level results alongside symbol contributions to understand where the combined outcome is concentrated.
Export Your Review and Keep a Journal Backup.
Use the available export and backup controls to retain report information and journal records outside the current workspace.
HTML Export
Export report information in HTML format for review outside the Reports workspace.
CSV Export
Export data in CSV format for further work in a spreadsheet or another compatible tool.
Backup & Restore
Create a journal backup and use the restore function when you need to bring back a saved backup.
Read the Result Alongside the Records Behind It.
Review each result in the context of your sample size, record quality and available measurements. Keep these boundaries in mind when comparing performance and drawing conclusions.
Sample Size
Check how many trades support the result. A narrow filter or a small classification group can produce a very different picture from the wider journal.
Record Quality
Missing trades, incomplete costs and inconsistent classifications affect the evidence available for review. Keep the underlying records complete and organised.
Measurement Boundaries
Realised equity and drawdown describe completed-trade results. They do not reconstruct every price movement or unrealised loss while a position was open.
About Trading Journal Reports
Understand how report filters, classifications and recorded trade data shape the evidence you review.
What are the seven Reports views?
Reports includes Overview, Performance, Trade Outcomes, Risk & Drawdown, Behaviour & Discipline, Classifications, and Accounts & Portfolio. Each examines a different part of the selected journal sample.
Can I review one account, market or period?
Yes. Use the date, broker-account and symbol filters to define the records you want to review. Additional filters are available for a more focused sample.
Do open positions affect realised performance and drawdown?
The realised performance and drawdown views use completed journal trades. Open-position monitoring is separate, and unrealised equity movements are not included in the completed-trade drawdown path.
Can I compare strategies, sessions and mistakes?
Yes. Classifications provides breakdowns for strategies, sessions, timeframes, R factors, primary tags, mistakes and other recorded categories. Their usefulness depends on the classifications attached to your trades.
Is Behaviour & Discipline the same as the Discipline workspace?
No. The report examines patterns in recorded trades, classifications and ratings. The separate Discipline workspace tracks your rules, tasks, habits and daily reflections.
Why do some trades appear as Not classified?
Those records do not have a value for the selected classification. Review and classify the underlying trades when you have the relevant context; do not assign labels simply to improve the report.
Do Reports include Sharpe, Sortino or intratrade excursion metrics?
The current Reports interface excludes Sharpe, Sortino, Calmar, MFE, MAE and intratrade exposure because the required complete daily-equity or price-path data is not available. It focuses on measures supported by the recorded evidence.
Are deposits and withdrawals treated as trading profit?
The Performance view presents capital flows separately from trading results so you can review deposits, withdrawals and recorded trading performance in context.
Can I export reports or back up my journal?
HTML and CSV exports, journal backup and restore are available according to your plan. Use the controls at the top of Reports and check your plan for access.
Can a positive report predict future results?
No. Reports summarise the selected historical records. Consider sample size, data quality, costs and changing market conditions when reviewing the results.
Make Your Next Trading Review More Informed.
Bring performance, outcomes, drawdown and trading context into one focused review of your recorded journal.